i-invest.homestead.com
Chart 3.3.1 Performance of TQQQ
Back to 3.0 Diversification.
Go to 4.0 About Inteererst Rates
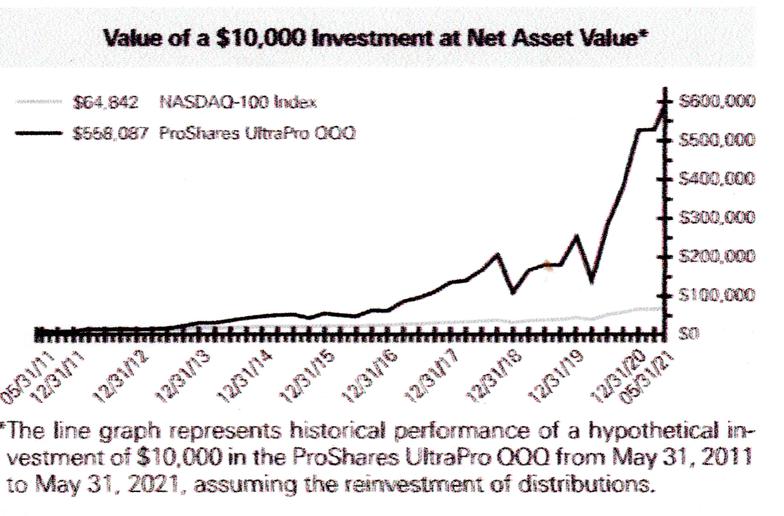
The chart below shows the performance of TQQQ from inception on Feb 9, 2010 to May 31, 2021
where $10,000 invested in TQQQ at inception in 2010 would have a value of $558,087 on May 31, 2021.
 | ||||
||
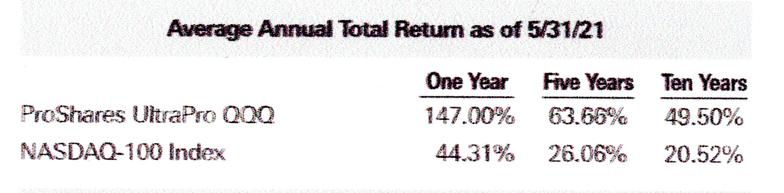
Below is the Average Annual Return of TQQQ compared to the NASDAQ-100 Index
For comparison: the two other major market indexes, S&P500 and DOW30 are as follows:
One Year Five Years
S&P-500 Index 31.17% 18.02%
Dow Jones 30 Index 33.32% 17.95%